LinkedIn® reach is harder to earn in 2026: AuthoredUp found average reach fell 34% in 2025 and dropped for 98% of users. Large studies tie posting more often, document posts and personal profiles to better results, but each figure depends on who and what was measured, so test changes against your own baseline.
Key takeaways
- AuthoredUp’s analysis of 621,833 posts found that average LinkedIn® reach dropped 34% in 2025 and that reach was down for 98% of users compared with the prior year, so a weaker post than last year is the norm before it is a verdict on your writing (AuthoredUp).
- Buffer’s study of more than 2 million posts from 94,000+ accounts found that posting 2 to 5 times a week added an average of 1,182 impressions per post, 6 to 10 added 5,001 and 11 or more added 16,946, each compared with the same accounts’ once-a-week weeks (Buffer).
- Document posts earned a 1.39x reach multiplier and 12.92% of all saved posts in AuthoredUp’s data, while multi-image posts averaged a 6.45% engagement rate against 5.30% for single images in Socialinsider’s business-page data (AuthoredUp, Socialinsider).
- Metricool found a 63% higher engagement rate for personal profiles than for company pages across 673,658 posts, and Socialinsider’s 5.20% average covers business pages only, so the two numbers should not be compared directly (Metricool).
- Posts of 800 to 1,000 characters and a Tuesday or Wednesday 8 to 9 AM slot are the length and timing findings with registered sources; treat both as starting hypotheses for your own test, not rules (AuthoredUp, Hootsuite).
- Every figure here is an average from one sample, so change one thing at a time, compare against your own earlier posts and keep a dated note of what each source measured.
Why do LinkedIn® statistics matter in 2026?
LinkedIn® statistics matter in 2026 because the audience is large, reach per post has fallen, and a benchmark from the right sample is the quickest way to tell whether a weak post is a problem or simply the norm. LinkedIn® has more than 1 billion members according to Hootsuite’s LinkedIn® statistics roundup, and AuthoredUp’s analysis of 621,833 posts found that average reach dropped 34% in 2025 and that reach was down for 98% of users compared with the prior year.
Those two facts pull in opposite directions. The audience keeps growing, yet each post reaches a smaller share of the people who could see it. That makes it tempting to hunt for a trick. A better response is to learn what the large studies actually measured, then compare your own posts against your own history.
The feed itself follows a pattern worth knowing. Hootsuite describes the LinkedIn® algorithm as three steps: quality filtering, engagement testing and network ranking. Quality filtering is the first of those steps, where a post is screened for quality before it is tested with an audience. These statistics cannot tell you the criteria for that screening, so the practical response is to write something specific and useful, which is why this guide keeps returning to your own perspective and voice.
Context matters here too. Metricool’s State of AI in Social Media report found that 96% of social media professionals use AI tools in their workflows and 72.5% use them daily. That is a survey of social media professionals across platforms, not a LinkedIn® measurement, so we use it only as background: when most of your peers use the same tools, the posts that stand out are the ones that carry a real opinion, a real example or a real number.
Below, each section opens with the answer, then shows the evidence, the limits and one thing you can do with it. In November 2026 we re-read the AuthoredUp, Socialinsider, Metricool and Buffer pages behind the newer figures to confirm that each number, sample size and date appears where we cite it.
How much has LinkedIn® reach changed?
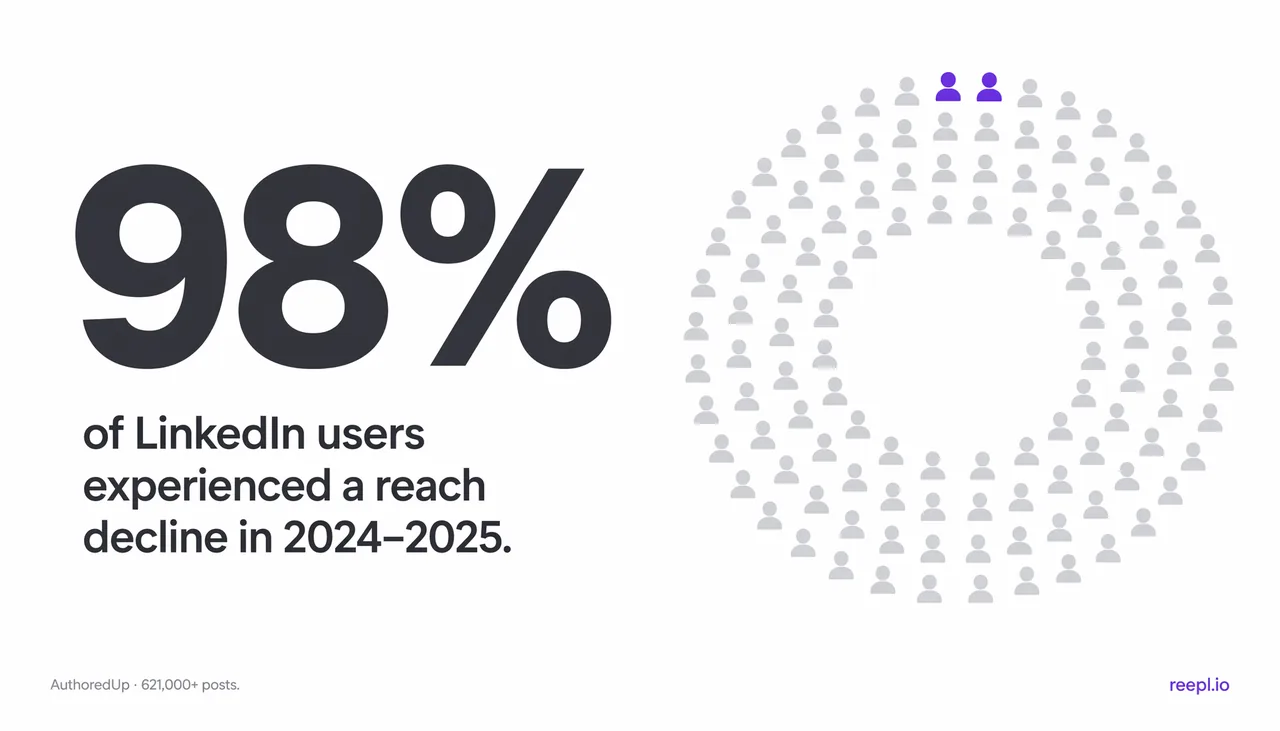
Average LinkedIn® reach dropped 34% in 2025, and reach was down for 98% of users compared with the prior year. Those figures come from AuthoredUp’s analysis of 621,833 posts, which it combined with Richard van der Blom’s Algorithm Insights research (AuthoredUp, how the LinkedIn® algorithm works).
Two details keep those numbers honest. First, 34% is an average across accounts, so some accounts fell further and some held steady. Second, 98% counts how many users saw a decline, not how large each decline was. Together they say the direction is close to universal. They do not say your next post will lose a third of its reach, and they do not say why reach fell.
What should you do with a reach number?
- Compare like with like. Put posts of the same format, on the same weekday, at the same age side by side, because a post checked after an hour cannot sit next to one that has circulated for weeks.
- Wait for at least four posts of the same type before calling anything a trend. One weak post is usually noise.
- Track something closer to your goal than impressions: saves, substantive comments and relevant messages. Impressions are not leads or revenue.
If you want the mechanics behind these numbers, our guides to how the LinkedIn® algorithm works and to why LinkedIn® posts get no views explain what the platform documents and what remains folklore.
What is a good LinkedIn® engagement rate in 2026?
A typical LinkedIn® engagement rate for business pages is 5.20%, and personal profiles tend to do better than company pages: Metricool measured a 63% higher engagement rate for personal profiles on average. The two numbers describe different groups, so neither is a universal target.
Engagement rate is the number of reactions, comments, shares and clicks on a post divided by a base such as impressions or followers. Sources choose different bases and count different interactions, so a rate from one study cannot be placed beside a rate from another without checking the definition first.
Socialinsider’s LinkedIn® benchmarks put the average organic engagement rate at 5.20% across 2,450,610 posts from 26,114 business pages with 1,000 to 1,000,000 followers. Its methodology note says the figures are 2025 values. The page gives no year-over-year change for that overall average, and it covers business pages only, not personal profiles.
Metricool’s April 2026 LinkedIn® study compared personal profiles with company pages across 673,658 posts from 63,108 accounts, using January to February 2025 against January to February 2026. It found that personal profiles outperform company pages, with a 63% higher engagement rate on average.
| Source | Who was measured | Sample and period | Finding |
|---|---|---|---|
| Socialinsider | Business pages with 1,000 to 1,000,000 followers | 2,450,610 posts from 26,114 pages, 2025 values per its methodology note | Average engagement rate of 5.20% |
| Metricool (April 2026) | Personal profiles and company pages | 673,658 posts from 63,108 accounts, January to February 2025 against January to February 2026 | Personal profiles had a 63% higher engagement rate on average |
What to do: pick the benchmark that matches your account type. If you run a company page, 5.20% is a reference for pages of similar size. If you post as yourself, Metricool’s result suggests the personal profile is the stronger channel for a given writer, but it is an average across accounts and says nothing about your audience. Calculate the median engagement rate of your last ten posts and use that as your own baseline.
Which post formats perform best on LinkedIn®?
Document posts, which many members call carousels, have the strongest format data in the sources we reviewed: AuthoredUp measured a 1.39x reach multiplier, meaning 39% more reach and 30% more engagement than a profile’s typical post. Multi-image posts averaged a 6.45% engagement rate in Socialinsider’s business-page data, against 5.30% for single-image posts.
A reach multiplier compares a format’s reach with the same profile’s own typical post, so a 1.39x multiplier means 39% more reach than that profile usually gets. AuthoredUp’s analysis of best-performing content reports it for personal profiles across more than 3 million posts, with a stated window of March 2025 to February 2026.
Saves tell a similar story. AuthoredUp reports that documents account for 12.92% of all saved posts on LinkedIn®, roughly 2.6 times their share of total content, and that only 4.88% of profiles post documents regularly. A save is a signal that a reader wants to come back to a post, and a document is easy to come back to. The small share of profiles using the format suggests it is less crowded than text, though that is our inference, not a finding in the source.
| Format | Measure | Who was measured | Source |
|---|---|---|---|
| Document posts | 1.39x reach multiplier, 39% more reach, 30% more engagement | Personal profiles, 3 million+ posts | AuthoredUp |
| Document posts | 12.92% of all saved posts | AuthoredUp’s saved-post analysis, March 2025 to February 2026 | AuthoredUp |
| Multi-image posts | 6.45% average engagement rate | Business pages, 2025 values | Socialinsider |
| Single-image posts | 5.30% average engagement rate | Business pages, 2025 values | Socialinsider |
One caution about dates. AuthoredUp’s page is dated July 2025 but states a data window that runs to February 2026 and a September 2026 update, so we treat it as one vendor’s dataset rather than an audited benchmark. The two sources also measure different accounts, so do not subtract one figure from the other.
What to do: test one document post for every two or three text posts and compare saves and substantive comments, not only impressions. If you already have a long article or newsletter, our guide to turning an article into a LinkedIn® document carousel shows how to cut it down without losing the argument.
How often should you post on LinkedIn®?
Buffer’s data shows more posts per week going with higher impressions per post: 2 to 5 posts a week added an average of 1,182 impressions per post, 6 to 10 added 5,001, and 11 or more added 16,946, each compared with the same accounts’ once-a-week weeks. That is a pattern in observed accounts, not a promise, and no number here is a limit or a target.
| Posts per week | Extra impressions per post | Engagement rate change |
|---|---|---|
| 1 (the comparison point) | None | None |
| 2 to 5 | +1,182 | +0.23 percentage points |
| 6 to 10 | +5,001 | +0.76 percentage points |
| 11 or more | +16,946 | +1.40 percentage points, with 3x more engagements |
The sample is more than 2 million LinkedIn® posts from 94,000+ accounts, published by Buffer in August 2025 without a stated date range (Buffer, how often to post on LinkedIn®). Buffer compared each account against its own once-a-week weeks, which controls for differences between accounts. It also notes that raw engagement rates look higher at one post a week and calls that comparison misleading. Our reading is that a small number of posts to a warm audience can produce a high rate on little reach.
Three limits apply. The study is observational, so it cannot show that posting more caused the gains; accounts that post 11 or more times a week may have a team, a larger audience or a stronger offer. The study does not measure what a post cost to write. And posting frequency is an editorial choice, not a platform guarantee: more posts of weaker quality can hurt a reputation that reach cannot repair.
What to do: move up one band you can sustain for eight weeks. If you post once a week, try three. Keep format and length steady so frequency is the only thing that changes, and judge the result on saves, substantive comments and relevant messages as well as impressions.
What do length, timing, links and saves tell you?
Four smaller findings are worth testing: posts of 800 to 1,000 characters, publishing at 8 to 9 AM on Tuesdays and Wednesdays, keeping external links out of the post body, and writing posts people save or repost. Each has a registered source, and each is a hypothesis for your audience rather than a rule.
- Length. AuthoredUp reports that posts are getting shorter and that 800 to 1,000 characters is the sweet spot (AuthoredUp). Treat it as a range to test against your usual length, not as a minimum.
- Timing. Hootsuite’s analysis named 8 to 9 AM on Tuesdays and Wednesdays as the best time to post on LinkedIn® in 2025. It cannot know your readers’ time zone or routines, so check it against when your own posts get early comments.
- Links. In Hootsuite’s engagement experiment, posts with external links in the body got less engagement and reach. It is one experiment, so keep the link out of the body for a few posts and compare, as one of several tests.
- Saves and reposts. AuthoredUp reports that saving and instantly reposting are the strongest drivers of reach in 2025 (AuthoredUp). Frameworks, checklists and clear examples are the kinds of posts a reader keeps.
Our guides to the LinkedIn® golden hour and to LinkedIn® ranking signals explain why a single best hour or length rarely holds across audiences, and how to run the comparison yourself.
Why do LinkedIn® statistics disagree with each other?
LinkedIn® statistics disagree because they measure different accounts, baselines, time windows and definitions. A figure that looks contradictory is usually a figure about something else.
| Reason | Example from this guide |
|---|---|
| Different account types | Socialinsider’s 5.20% covers business pages, while AuthoredUp’s multipliers cover personal profiles. |
| Different baselines | AuthoredUp compares a format with each profile’s own typical post, while Buffer compares each account with its own once-a-week weeks. |
| Different time windows | Metricool compares January to February 2025 with January to February 2026, AuthoredUp’s reach figures describe 2025, and Buffer states no period. |
| Different definitions | Engagement rate can use impressions or followers as its base, and sources count different interactions. |
We also left out three widely repeated claims we could not support when we re-read those sources in November 2026. First, the claim that the feed is powered by a model called 360Brew: the research paper’s abstract calls 360Brew a research pre-production model and does not say it runs the feed. Second, AuthoredUp’s figure that indirect comments lift reach by up to 2.4x, which its page attributes to its own research without naming a dataset. Third, a single length for the golden hour: AuthoredUp’s own page gives 30 to 60 minutes in one place and 60 minutes in another.
What to do: before you quote or act on a number, write down who was measured, how many, over what period and how the metric was defined. If the source does not say, treat the number as an anecdote.
How can you turn these statistics into a test? A worked example
The example below is illustrative, not a case study. It shows the shape of a clean test, and the numbers in your own log will be your own.
Imagine a consultant who posts once a week, in text, at roughly the same length each time. The statistics above suggest that more frequent posting is the change with the largest observed upside, and Buffer’s 2 to 5 posts a week band is a step the consultant can sustain. So the consultant tests frequency and holds everything else constant.
| Step | What the consultant does | What they record |
|---|---|---|
| Weeks 1 to 4 | Posts once a week, as usual | Impressions, saves and substantive comments at seven days |
| Weeks 5 to 8 | Posts three times a week with the same format and length | The same three measures at seven days |
| Review | Compares the median post in each period | Median impressions, saves, substantive comments and any relevant messages |
| Decision | Keeps, drops or adjusts the change | One line on what they learned and what to test next |
Four design choices make the result trustworthy. The consultant changes one variable, which mirrors how Buffer compared accounts against their own once-a-week weeks. They check every post at the same age, seven days after publishing. They compare medians rather than averages, so one unusually popular post cannot hide the rest. And they set the decision rule before the test: keep the change if saves and substantive comments per post hold steady or rise and the schedule is sustainable, and drop it otherwise.
Real life will interfere. A holiday week, a news event or a post that a well-known person reshares will distort a four-week window, so note any unusual event next to the post and exclude it from the median if it clearly dominated. If the result is unclear after eight weeks, run the same test for another four rather than reading meaning into noise.
The same structure works for any statistic in this guide. Replace frequency with document posts, an 800 to 1,000 character length or a Tuesday morning slot, keep everything else stable, and let your own audience answer the question the study cannot.
What mistakes do people make with LinkedIn® statistics?
The most common mistake is treating an average as a target. An average describes a group of accounts, and your account is one of them. Other mistakes follow from the same habit:
- Mixing account types. Comparing a personal profile with a business-page benchmark makes both numbers meaningless.
- Copying a cadence you cannot sustain. A schedule that collapses after three weeks does more harm than a steady one at a lower frequency.
- Choosing a format because its statistic is large. A document post with nothing new to say still has nothing new to say.
- Quoting stale or undated numbers. A figure without a source, sample and date cannot be checked, so leave it out of your own posts as well.
- Reading causation into observation. Every study here is observational, so none of them proves that a change will raise your results.
It is also worth knowing where this guide is limited. Every statistic comes from a third party, most from vendors that sell social media tools, and none comes from Reepl’s own data. We cite only figures whose source, sample and period we could read ourselves, and we mark the ones with caveats. When the evidence is thin, the guide says so rather than rounding it into a rule.
How can Reepl help you run the test?
Reepl is an AI writing platform that puts your social media on autopilot in your own voice: it finds what to post about, drafts your posts, and keeps your calendar full, and you decide how much it does without asking. For an eight-week test like the one above, three parts matter.
- Voice profiles guide the style of a draft from posts you supply, and you review the draft before anything is published.
- Andy routines can prepare a post on a schedule you set, for a personal LinkedIn® profile, on a paid plan (Pro or higher). You choose the review mode: Send for review (the default), Save as drafts or Schedule directly.
- The content calendar shows what is queued, so you can see whether you are really posting three times a week.
Reepl cannot tell you which frequency or format works for your audience, and neither can the statistics above. It makes the test cheaper to run. On LinkedIn®, you remain the person who comments and messages.
Summary
LinkedIn® reach has fallen for almost every user, so benchmark against your own history first. The strongest registered findings are that posting more often, using document posts and posting from a personal profile each went with better results, within the samples and periods described above. Every number is an average from a specific group, and several sources disagree because they measured different things. Pick one change, such as moving from one post a week to three, hold everything else steady for eight weeks, and compare medians at a fixed post age. Then keep or drop the change based on your own audience.
Test one change at a time
Bring your own context, review the draft, and keep the final wording yours.