Measure social media by tying each post to a defined goal, then tracking exposure, audience response, website actions and business outcomes as four separate layers. Keep LinkedIn®, X and Reddit metrics under their own names, tag every shared link with consistent UTM labels, and judge the work by qualified outcomes.
Key takeaways
- Reach, impressions and views describe exposure; a business result is a qualified inquiry, a suitable applicant or a sale.
- Compare posts within the same platform and metric definition before comparing channels.
- Use consistent UTM tags to identify traffic from links you share.
- Define a meaningful website action before labeling traffic successful.
- Attribution records observed interactions only, so combine analytics with qualified conversation notes and customer-reported context.
Why do reach and business results need separate measures?
Reach generally describes the number of distinct accounts or people a platform reports as exposed to content, under that platform's definition. Impressions count displays under a platform's counting rules. Neither measure establishes whether a reader understood your offer, trusted your expertise, or became a customer.
A post can get broad exposure while attracting the wrong audience. Another can reach a smaller group and start a relevant buying conversation. You need exposure data to understand distribution, but you also need evidence about what happened after people encountered the post.
Begin with the outcome your publishing supports. A consultant might want qualified discovery calls. A recruiter might want suitable applicants. A software founder might want relevant trial users who complete an activation step. Each goal requires a different definition of success.
Write the definition before reviewing the dashboard. If success changes to whichever metric happens to rise, your report becomes a story about numbers and stops supporting decisions. A useful report can explain both what improved and why that improvement matters.
Write the definition as one sentence and keep it at the top of every report: “Success this period is [count] [qualified outcome, such as discovery calls] from [audience], recorded in [system], reviewed on [date].” For example, an illustrative recruiter might write: “Success this month is suitable applicants for the two open support roles, recorded in the applicant tracker, reviewed on the last Friday.”
Which metrics should you track at each stage?
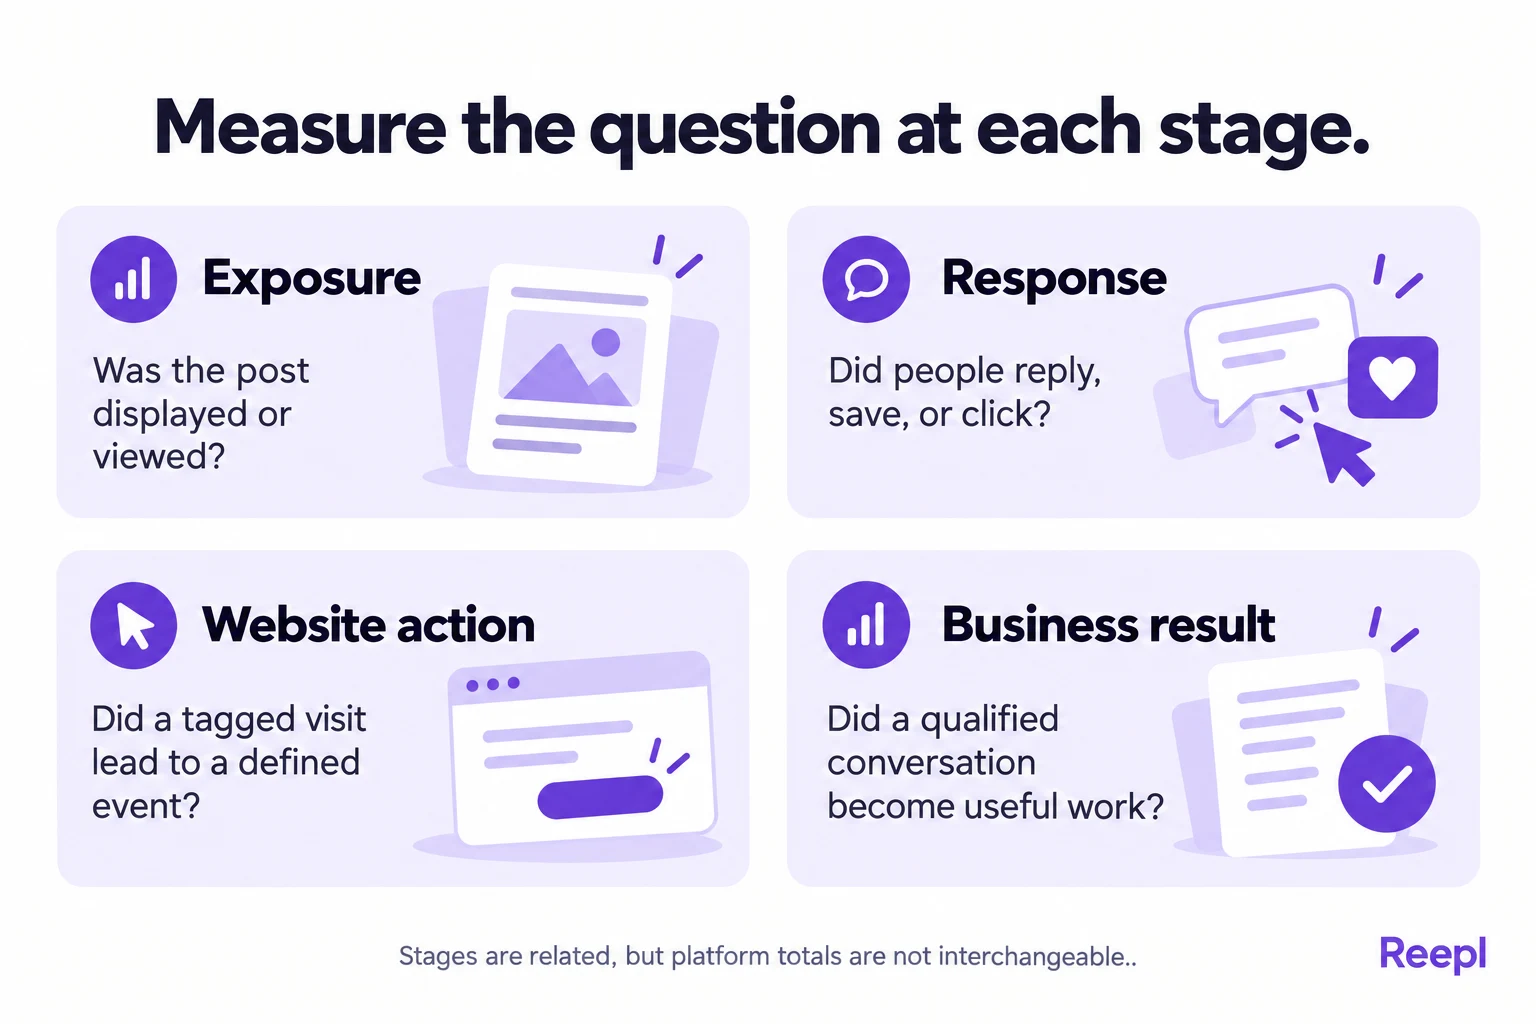
Track a small set of measures that answer distinct questions. Exposure tells you whether distribution occurred. Responses show observable reactions. Website events show actions you can record on your site. Business records show whether those actions led to useful work.
A key event in Google Analytics is an event you have marked as important to your business. Choose an action with a clear meaning, such as a completed inquiry; a page view on its own says little about intent. Google's event setup documentation explains how to implement and verify events.
| Stage | Example measure | Question it helps answer | Important limitation |
|---|---|---|---|
| Exposure | Platform impressions or views | Was the content displayed or viewed? | Counting rules differ |
| Response | Relevant replies or link clicks | Did readers take an observable action? | An action can have many motives |
| Website | Completed inquiry event | Did the visitor finish the intended step? | Tracking can miss or duplicate actions |
| Business | Qualified call or signed project | Did the action create relevant opportunity? | Social influence may be incomplete |
Keep diagnostic metrics alongside your primary outcome. If inquiries fall, link clicks can help you investigate whether the problem began in distribution or on the website. If clicks hold steady but completed forms drop, check the page and form before rewriting every post.
Combine responses into one “engagement” total only when the formula is written down. A brief reaction and a detailed buyer question are both observable actions, but they are not interchangeable evidence. Keep a few qualitative notes beside the counts.
How do LinkedIn®, X, and Reddit metrics differ?
Keep native metrics labeled with their platform and exact name. A view on one platform should not silently become reach in a combined report. You can put metrics side by side, but the labels and limitations must travel with the numbers.
LinkedIn®'s post analytics guidance describes the analytics available for your content. Check the definitions and availability for the specific post and account you are reviewing. Record unavailable measures as unavailable, and keep zero for measures that exist and recorded nothing.
X's view-count documentation explains that repeated views can count and that your own view can count too. A displayed view count therefore should not be described as a count of unique people reached or potential customers exposed.
Reddit's Post & Comment Insights guidance describes the available performance measures. Use those alongside the discussion itself. A community response depends on context, relevance, and local rules. Votes show a community's reaction, which is a different thing from purchase intent, and a discussion gives you no permission to add promotional links beyond what that community's rules allow.
Choose comparable windows when reviewing posts. A post observed after a week has had more opportunity to accumulate responses than one published yesterday. Record the publication date, reporting date, and whether the totals are lifetime or limited to a reporting period.
Separate paid and organic activity where the data allows. A paid distribution experiment answers a different question from a normal organic post. Mixing them can make an apparent improvement in content quality disappear once you account for the different distribution conditions.
How should you use UTM tags for social links?
UTM parameters are labels added to a URL so analytics tools can identify campaign traffic. Use a consistent naming convention for the links you control. The labels help describe a visit's source; people who saw the post without clicking stay invisible to them.
Google's campaign configuration reference explains how campaign information is collected. For a practical starting convention, use utm_source for the platform, utm_medium for the traffic category, and utm_campaign for the initiative you want to evaluate.
Use utm_content to distinguish a particular post or creative variation. Pick lowercase labels and document them before publishing. Differences in capitalization or spelling can fragment your reporting, making one initiative look like several unrelated campaigns.
| Parameter | Illustrative value | Meaning |
|---|---|---|
utm_source | linkedin | The platform where you placed the link |
utm_medium | organic_social | Your chosen traffic category |
utm_campaign | interview_guide | The initiative or resource |
utm_content | question_checklist | The specific post or variation |
Build the query string from the four parameter names and illustrative values in the table: [your-page-url]?utm_source=linkedin&utm_medium=organic_social&utm_campaign=interview_guide&utm_content=question_checklist. The platform name in a URL is a technical label. Use similarly stable values for X and for Reddit links shared where relevant and permitted.
Test each tagged link before publishing. Confirm that it opens the right page, survives any redirect, and appears as expected in your analytics setup. A neat naming scheme is not useful if a redirect removes the parameters or the destination fails on mobile.
Keep names, email addresses and confidential customer details out of campaign parameters. Links are visible and shareable. Also avoid adding acquisition campaign tags to ordinary internal navigation, where they can complicate the interpretation of how a visitor arrived.
What can attribution tell you, and what can it miss?
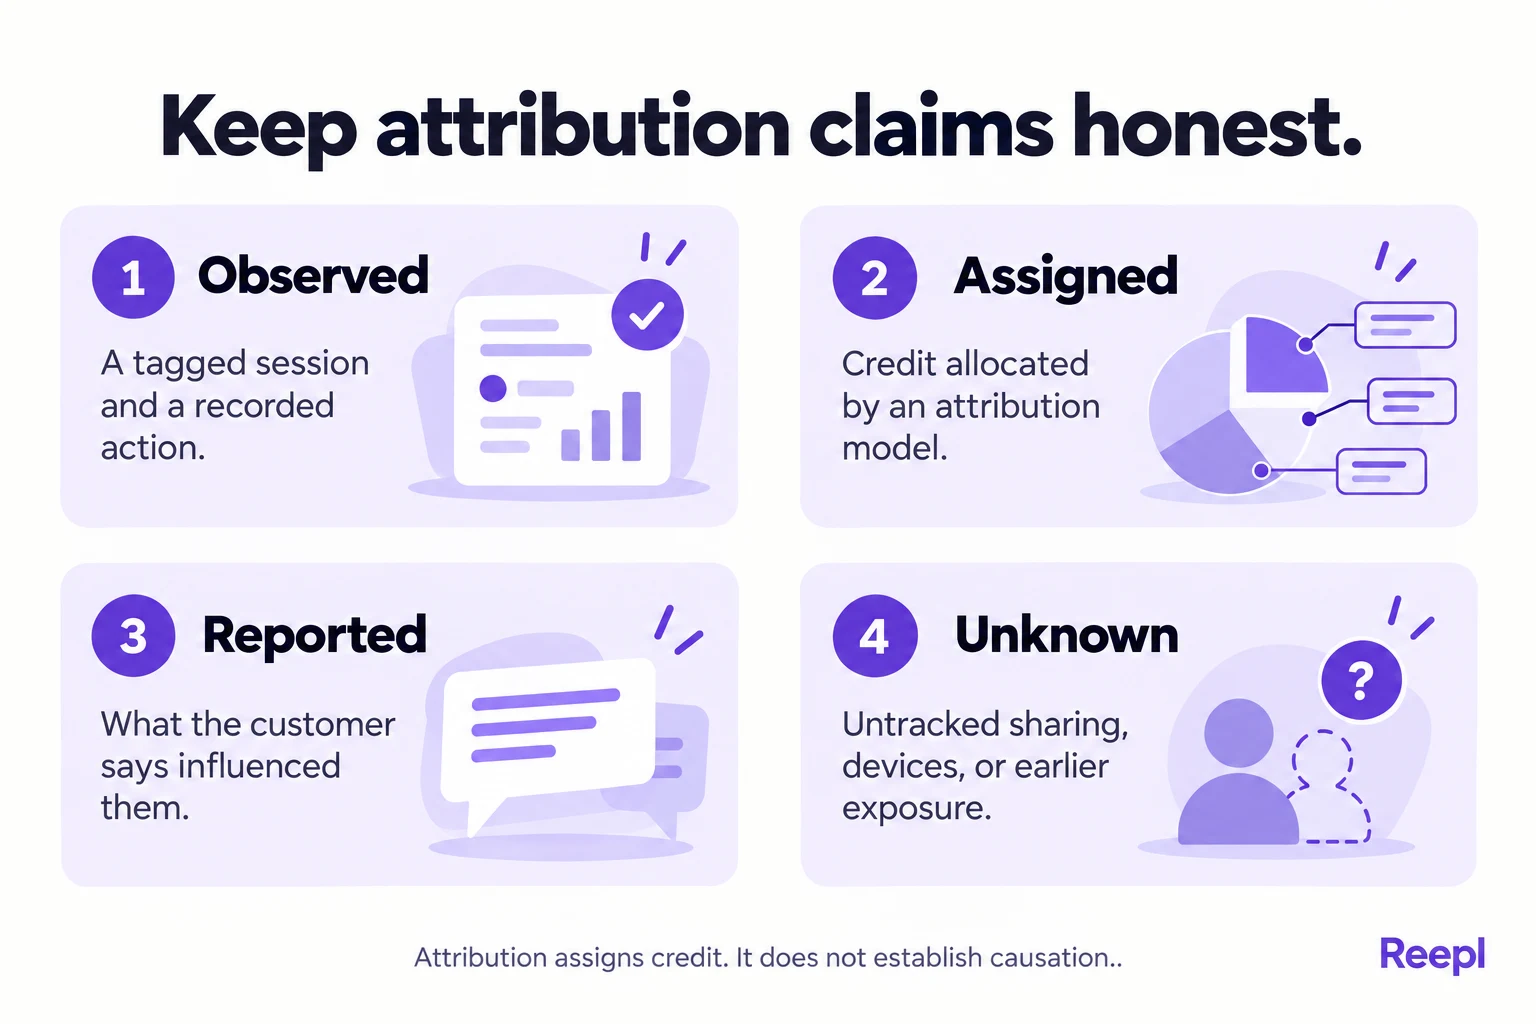
Attribution is the method an analytics system uses to assign credit for an action to recorded interactions. The result depends on the available data, the model, the reporting scope, and the time window. It is an accounting of observed interactions, not a complete biography of the buyer.
A person might read a LinkedIn® post, discuss it privately, later search your name, and submit a form from another device. Your website report may show search or direct traffic even when the social post influenced the decision. An untagged or copied link can also lose useful context.
Record which attribution model and report you use before comparing results. Check whether the report describes how a session began or how credit for a later action was assigned. A change in credit assignment can change the numbers without changing the underlying customer behavior.
Consent choices, blocked scripts, device changes, and untracked offline conversations can leave gaps. Treat those gaps as uncertainty. Leave unattributed business unattributed, even when the sales team remembers a few people mentioning a post.
Add a short, optional question to your inquiry process, such as “What prompted you to contact us?” Keep the answer alongside the recorded source. Customer recollection is also imperfect, but it can reveal context that a campaign parameter cannot capture.
Use careful language in reports: “The inquiry followed a tagged visit” is stronger evidence than “This post caused the sale.” Causation usually needs a different research design. Ordinary social analytics can guide decisions without supporting a causal claim about every outcome.
What does a useful measurement example look like?
Consider an illustrative consultant publishing an interview-question checklist. The consultant adapts the idea for LinkedIn®, writes an X post about one mistake, and contributes a relevant answer to a Reddit discussion under that community's rules. Each post is adapted to its own context.
The following numbers are invented to demonstrate interpretation, not benchmarks or reported campaign results. Suppose the tagged links produce 40 website sessions from LinkedIn®, 60 from X, and 20 from an allowed Reddit reference during the chosen reporting period.
Suppose the website records four completed inquiries from the LinkedIn® sessions, one from X, and two from Reddit. The observed inquiry-per-session figures would be 10%, about 1.7%, and 10%. Those calculations describe this small fictional dataset and should not become performance expectations.
The business review adds context: two of the LinkedIn® inquiries match the consultant's service, the X inquiry is a student research request, and one Reddit inquiry is a relevant prospect. The other inquiries remain useful conversations, but they fall outside the predefined qualification rule.
A superficial report would declare X the winner because it produced the most sessions. Another might declare Reddit equally effective based on inquiry rate. Both claims ignore small samples, different audiences, and the distinction between an inquiry and a qualified opportunity.
A better report line keeps all three layers together: “LinkedIn®: 40 tagged sessions, four inquiries, two qualified. X: 60 sessions, one inquiry, none qualified. Reddit: 20 sessions, two inquiries, one qualified. Samples are small; repeat the checklist post and improve the X destination before drawing conclusions.”
The better next step is to inspect the conversations and repeat the useful work. The consultant might improve the X destination or framing, continue answering relevant community questions, and test another practical checklist. No channel needs to be abandoned because of one small reporting period.
Record effort as well. A channel that creates relevant conversations but requires substantial preparation may still be worthwhile, depending on the value of the work. Keep preparation time and business outcomes visible without pretending that every hour has a precisely attributable return.
How do you build a weekly report you can act on?
Build the report around a decision, such as which topic to develop next or where a website journey needs attention. Use consistent reporting windows and preserve the raw platform labels. A concise report with one clear decision is more useful than a large dashboard nobody uses.
Use this review template:
- State the business goal and the qualification rule.
- List the posts and their native exposure measures.
- Record meaningful replies, tagged visits, and completed actions.
- Add qualified opportunities and customer-reported context.
- Note missing data, unusual distribution, and tracking changes.
- Choose one adjustment and explain the evidence behind it.
Review tracking failures before celebrating or diagnosing a large swing. A duplicated form event can make results appear to improve overnight. A broken redirect can make a successful post look ineffective. Check implementation whenever the numbers change in a way the surrounding activity does not explain.
Keep the interpretation proportional to the evidence. A single week can reveal a broken form or an unclear message. It rarely proves a durable channel advantage. Use repeated observations and relevant conversation notes to decide whether a pattern deserves a larger test.
What should a measurement ledger look like?
A measurement ledger connects each post to its intended job and the evidence available afterward. Use one row per post or clearly defined campaign unit. Keep the platform's original metric names so a future reviewer can reconstruct what the figures mean.
| Field | What to record | Why it matters |
|---|---|---|
| Post identity | Permalink, platform, publication time and format | Connects the report to a real item |
| Purpose | Audience decision and intended next action | Prevents changing the goal after seeing results |
| Observation window | Collection time and period covered | Makes unequal post ages visible |
| Native response | Exact metric labels and meaningful reply notes | Separates platform counts from interpretation |
| Website evidence | Campaign labels, visits and defined events | Shows the observable path after a click |
| Business evidence | Qualification outcome and relevant customer context | Distinguishes activity from suitable opportunity |
| Limitations | Missing data, tracking changes and unusual distribution | Keeps uncertainty attached to the result |
Keep operational metadata separate from personal information. The ledger does not need a copy of every prospect's messages. Where a business record contains sensitive detail, refer to its authorized location and summarize only what is necessary for the content decision.
Use a defined missing-data convention. “Unavailable” means the source does not provide the metric. “Not collected” means your process did not capture it. Zero means the measurement exists and recorded no events. These states support different decisions, so leaving an ambiguous blank is less helpful.
How do you investigate a sudden change in results?
Trace the chain from publication to business record and find the first observable change. If distribution fell but website completion among visitors stayed similar, the issue may be earlier in the path. If visits continued while form completions disappeared, inspect the destination and event collection before changing the content strategy.
Start with implementation checks. Open the tagged destination on a phone, follow the redirect and complete an authorized test submission if you control the site. Inspect whether the intended event fires once at successful completion. Exclude your test from the business report.
A button-click event and a successful-submission event answer different questions. The first can fire even if validation prevents the form from sending. Name them differently and choose the event that matches your defined outcome. Google's event documentation supports testing collection; your own form behavior determines what the event should represent.
Check whether a site release, consent change or campaign naming change occurred during the reporting period. A reporting discontinuity may look like an audience shift. Record the date of the implementation change and avoid comparing the periods as though the measurement system were unchanged.
Then inspect qualitative evidence. If the post attracted many questions from people outside your target audience, the opening may be too broad. If suitable readers clicked but said the offer was unclear, the destination may need work. The numbers locate the question; the conversations can help explain it.
How can you compare formats without claiming a causal result?
Compare similar work within a defined context and describe the comparison as observational. A document carousel, an X thread and a Reddit answer differ in audience, distribution and purpose. A difference in outcomes between them cannot be attributed to format alone.
For a practical editorial comparison, hold the reader problem and destination reasonably consistent. Record the topic, format, timing, distribution conditions and effort. Use similar observation windows. Choose the decision you intend to make before collecting results, such as whether another worked example deserves preparation time.
An illustrative consultant might compare two posts that explain different parts of the same interview checklist. If one attracts more qualified questions, inspect the subject matter before assuming its layout caused the difference. A more urgent question can outperform a more polished format for reasons the dashboard cannot isolate.
Skip the elaborate return figure when all you have is a handful of ambiguous leads. If revenue has not been realized, report qualified opportunities as opportunities. If several channels influenced a purchase, show the attribution method and the customer-reported context instead of assigning the entire sale to the post you prefer.
Effort still matters. Record research, writing, design and follow-up time using a practical consistent method. A format that creates useful conversations but consumes the whole content budget may need simplification. Another format may deserve continued use because it answers a recurring sales question, even when immediate tracked traffic is modest.
Write the decision in plain language: “Continue the interview examples because they generate relevant questions; simplify the design; check the destination copy before increasing distribution.” Add what would change that decision. This makes the report useful while keeping its conclusion within the evidence.
Your next measurement improvement should usually be one missing definition or broken link in the chain. Define a qualified inquiry, repair an event or standardize campaign labels before building a larger dashboard. Better measurement begins with knowing what an observed action means.
Where does Reepl fit in a measurement workflow?
Reepl is an AI writing platform that puts your social media on autopilot in your own voice: it finds what to post about, drafts your posts, and keeps your calendar full, and you decide how much it does without asking.
Use the same content question and campaign naming convention throughout planning, drafting, and review. Keep your platform reports, website events, and business records available when evaluating the work. Whatever publishing workflow you use, check how each measurement system defines and collects its data.
Continue with our guides to choosing questions worth answering and planning a traceable publishing workflow.
Put your next idea into words
Draft in your voice, review the details, and choose what to publish.